|
state by state |
|||||||||||||||||||||||||||||
|
Links:
State by state Alabama Alaska Arizona Arkansas California Colorado Connecticut Delaware District of Columbia Florida Georgia Hawaii Idaho Illinois Indiana Iowa Kansas Kentucky Louisiana Maine Maryland Massachusetts Michigan Minnesota Mississippi Missouri Montana Nebraska Nevada New Hampshire New Jersey New Mexico New York North Carolina North Dakota Ohio Oklahoma Oregon Pennsylvania Puerto Rico Rhode Island South Carolina South Dakota Tennessee Texas Utah Vermont Virginia Washington West Virginia Wisconsin Wyoming |
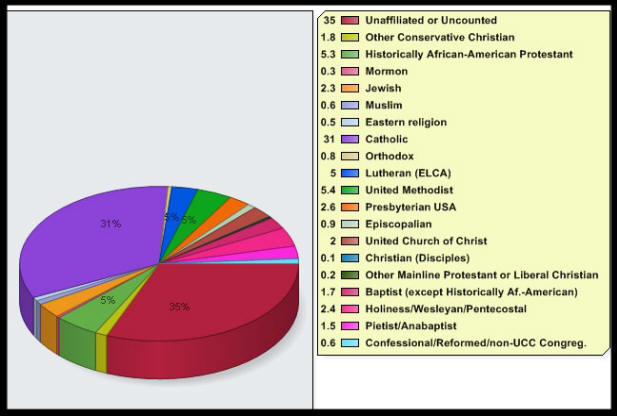
Pennsylvania Primaries: No Republican Exit Poll Pennsylvania: Religious demographics chart
Primary Results: Democrat
Republican
Commentary Democrat Where white Protestants went for Clinton by 58 percent to 42 percent, white Catholics split 71-29 in her favor. That was the worst showing for Obama among white Catholics anywhere in the nation, not excluding New York. In Ohio (so often compared to Pennsylvania), Obama actually did better among white Catholics (34-65) than among white Protestants (30-67). The explanation would seem to be that Pennsylvania’s white Catholics are more working class, more classic Reagan Democrat than Ohio’s, while the Keystone State’s white Protestants comprise many fewer evangelicals, and a lot more moderate-to-liberal suburbanites. In other categories, Jews went for Clinton, but by a smaller margin than white Protestants. Unaccountably, all Jews were slightly more pro-Clinton (57-43) than white Jews (56-44). As usual, those of non-Judeo-Christian faiths and of no religion went strongly for Obama. On the attendance scale, Clinton won all categories handily except the Nevers, though the More-than-Weeklies split for here by the narrowest of margins, 51-49. But the big religion story of the primary was the overwhelming Catholic support for Clinton--and the utter failure of popular Catholic pro-life governor Bob Casey, Jr. to move his co-religionists in the direction of his favored candidate. Republican No exit poll for what was a foregone conclusion.
|
||||||||||||||||||||||||||||