|
Links:
Spiritual Politics blog
State by State
Leonard E. Greenberg Center
State by
state
|
New York
Polls
New York Republican Exit Poll
New York Democratic Exit Poll
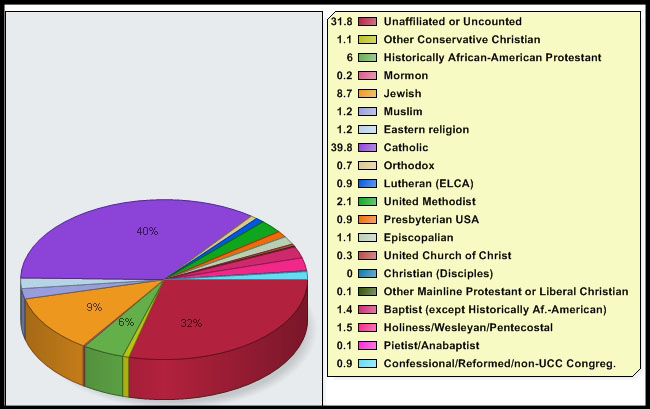
Religious
demographics chart
Republican Primary
Results
County Results
|
|
310,814
|
51%
|
101
|
|
|
168,801
|
28%
|
0
|
|
|
65,648
|
11%
|
0
|
|
|
38,918
|
7%
|
0
|
|
|
18,566
|
3%
|
0
|
Democratic Primary
Results
Commentary
Democrat
Clinton won in all the attendance categories except the
More-than-weeklies (six percent), which Obama won 53 percent to 47 percent.
Among the rest, only among the Nevers, did Clinton win by less than 10
points. In the religious groupings Clinton won Catholics by better than
two-to-one and Jews by almost as much. Non-Judeo-Christians also voted for
her, by 61 percent to 37 percent. Obama won the Protestants (including Other
Christians), 51 percent to 47 percent, but Clinton won white Protestants, 57
percent to 40 percent. By 52 percent to 44 percent, Obama took the Nones (no
religion).
Republican
In the attendance categories, Huckabee won a plurality of the
More-than-weeklies, with 33 percent, and McCain too all the others handily.
Only among the Nevers did he slip below the 50-percent mark; fully 18
percent of them went for Ron Paul—the Ayn Rand set. When it came to the
evangelicals, McCain beat out Huckabee 38 percent to 30 percent, with Romney
garnering 25 percent. Both Catholics and Protestants went for McCain by
hefty margins. Among the Other Christians—mostly white evangelicals—McCain
prevailed over Huckabee 43 percent to 30 percent. |