Spiritual Politics  

 state by state

Links:

Spiritual Politics blog

State by State

Leonard E. Greenberg Center

State by state

Illinois

Polls 

Illinois Democratic Exit Poll
Illinois Republican Exit Poll


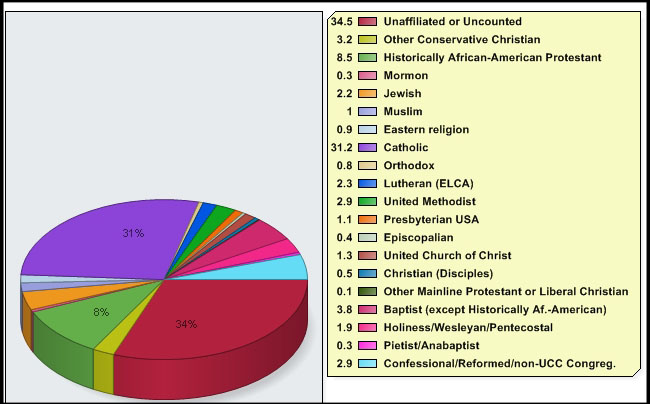
Religious demographics chart


Republican Primary Results

Illinois
Candidate
Votes
Vote %
Del*


424,071
47%
54
256,805
29%
2
147,626
17%
0
45,166
5%
0
11,341
1%
0

Democratic Primary Results

Illinois
Candidate
Votes
Vote %
Del*
 
County Results

 
1,301,954
65%
83
662,845
33%
42
39,001
2%
0


Commentary

Democrat
Even in his home state, Obama could not quite manage to win the Catholic vote, losing it to Clinton by a narrow 50 percent to 48 percent margin. White Catholics went to Clinton by 53 percent to 46 percent. No one liked Obama more than the non-Judeo-Christians, 84 percent of whom voted him. The Nones (those with no religion) came close, however, at 78 percent. White Protestants went his way by a margin of 56 percent to 41 percent.

Republican
Huckabee squeaked ahead of McCain with 33 percent of the more-than-weekly attenders. McCain won all other attendance categories. The evangelicals as a whole went for McCain by a hefty margin—38 percent for him as opposed to 28 percent for Huckabee and 27 percent for Romney. While this may say something about Illinois (Willow Creek-style) evangelicals, it suggest above all that without mounting a real mobilization campaign (cf. Florida), Huckabee was simply unable to win his base. In the Land of Lincoln, McCain won a bare majority of Catholics and a solid plurality of Protestants (including “Other Christians”).


Hit Counter