|
Links:
Spiritual Politics blog
State by State
Leonard E. Greenberg Center
State by
state
|
Massachusetts
Polls
Massachusetts Democratic Exit Poll
Massachusetts Republican Exit Poll
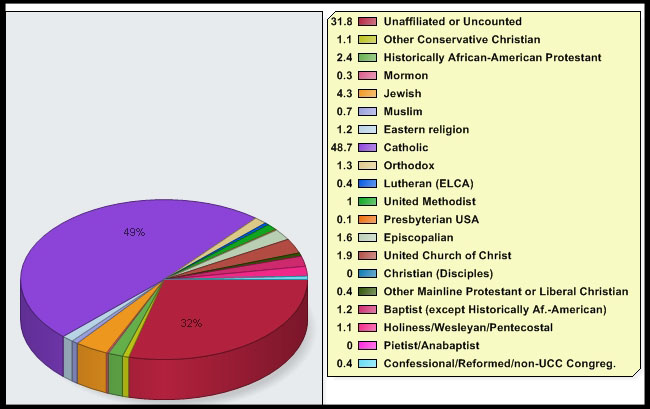
Religious
demographics chart
Republican Primary
Results
|
|
255,248
|
51%
|
22
|
|
|
204,027
|
41%
|
18
|
|
|
19,168
|
4%
|
0
|
|
|
13,210
|
3%
|
0
|
|
|
2,643
|
1%
|
0
|
| |
|
|
|
Democratic Primary
Results
Commentary
Democrat
Clinton won in all attendance
categories except the Nevers, among whom Obama eked out a one-percent
margin, 49 percent to 48 percent. Clinton carried Catholics (45 percent of
the total) by nearly two-to-one—64 percent to 33 percent; and Protestants
(including “Other Christians” 53 percent to 46 percent. Non-Judeo Christians
went for Clinton 49 percent to 46 percent. The only groups to go to Obama
were the Jews (52 percent to 48 percent) and the Nones (53 percent to 46
percent). Clinton’s strength almost across the board in the Bay State (in
the face of Kennedy support for Obama) is one of the most curious features
of the entire primary season.
Republican
Romney swept all levels of church
attendance, and took 53 percent of the evangelical vote, over McCain at 26
percent and Huckabee at 16 percent. This is one more piece of evidence that
New England evangelicals are like other New Englanders in resisting appeals
to vote on sectarian lines. Overall, Romney carried the Catholics by a 16
point margin while McCain carried the Protestants (not including
“Other Christians”) by five points. This may hark back to the old mugwump
(independent) streak in Massachusetts Yankeedom.
|