|
Links:
Spiritual Politics blog
State by State
Leonard E. Greenberg Center
Contributors
State by
state
|
New Jersey
Polls
New Jersey Democratic Exit Poll
New Jersey Republican Exit Poll
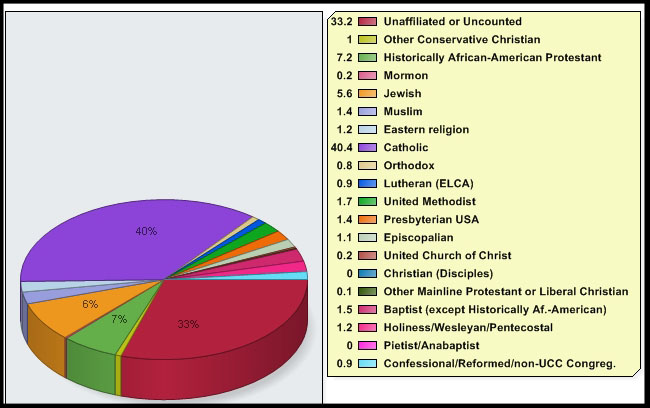
Religious
demographics chart
Republican Primary
Results
|
|
310,427
|
55%
|
52
|
|
|
158,974
|
28%
|
0
|
|
|
45,781
|
8%
|
0
|
|
|
26,952
|
5%
|
0
|
|
|
14,721
|
3%
|
0
|
Democratic Primary
Results
Commentary
Democrat
Clinton won all the attendance
categories except for the More-than-weeklies (10 percent of the whole), who
went to Obama by the substantial margin of 56 percent to 34 percent. Clinton
won white Protestants by a large margin, 66 percent to 32 percent—not much
less than she won white Catholics (71 percent to 26 percent). Jews went
strongly for Clinton as well, by 63 percent to 37 percent. Obama’s biggest
win was among the Other Christians (72 percent to 25 percent), followed by
the non-Judeo-Christians (61 percent to 35 percent), and the Nones (51
percent to 49 percent).
Republican
McCain won all attendance
categories, with Huckabee only creeping up among the More-than-weeklies.
McCain won the evangelical vote as well, solidly, with 38 percent—and Romney
actually beat out Huckabee for the lion’s share of the balance, 28 percent
to 26 percent. McCain won all the religious groupings handily, with Huckabee
only establishing a substantial position among the Other Christians, at 30
percent to McCain’s 50 percent. Romney was in the 30 percent range among
Protestants (not including Other Christians) and Catholics. |