|
Links:
Spiritual Politics blog
State by State
Leonard E. Greenberg Center
Contributors
State by
state
|
Tennessee
Polls
Tennessee Republican Exit Poll
Tennessee Democratic Exit Poll
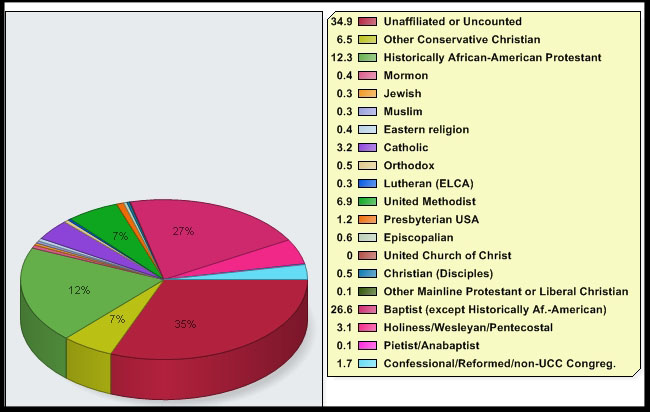
Religious
demographics chart
Republican Primary
Results
|
|
189,443
|
34%
|
23
|
|
|
174,763
|
32%
|
15
|
|
|
129,722
|
24%
|
8
|
|
|
30,730
|
6%
|
0
|
|
|
16,044
|
3%
|
0
|
|
|
5,100
|
1%
|
0
|
|
Uncommitted
|
1,812
|
0%
|
0
|
Democratic Primary
Results
|
|
332,599
|
54%
|
34
|
|
|
250,730
|
41%
|
21
|
|
|
27,644
|
4%
|
0
|
|
Uncommitted
|
3,123
|
1%
|
0
|
Commentary
Democrat
In this big Clinton win, all religious categories went for her. The
closest was in the “Other Christians” category, 40 percent of the vote that
split 49 percent to 47 percent. This seems to be a group composed largely of
evangelicals, black and white. Otherwise, the limited number of Catholics
(seven percent) were, in contrast to their co-religionists everywhere else
but in Missouri, more likely to vote for Obama than the Protestants were.
Republican
Huckabee won nearly half the More-than-weeklies and, at 35 percent, a
plurality of the Weeklies. Together, those two attendance groups constitutes
68 percent of the voters. (The other attendance groups all went by plurality
to McCain.) The 73 percent of voters identifying themselves as evangelicals
broke for Huckabee by 42 percent over McCain at 29 percent and Romney at 20
percent. Add in the non-evangelical Protestants and Huckabee got a plurality
of 37 percent. It is noteworthy that 41 percent of voters said that the
religious beliefs of the candidate mattered a great deal to them, and 54
percent of them voted for Huckabee. Romney, by contrast, won only 12
percent—as compared to getting about one-third of those who said those
beliefs matters somewhat, not much, or not at all. That 20-point
shortfall—eight percent of the GOP turnout—can be considered the anti-Mormon
vote.
|