|
state by state |
|||||||||||||||||||||||||||||||||
|
Links:
State by state Alabama Alaska Arizona Arkansas California Colorado Connecticut Delaware District of Columbia Florida Georgia Hawaii Idaho Illinois Indiana Iowa Kansas Kentucky Louisiana Maine Maryland Massachusetts Michigan Minnesota Mississippi Missouri Montana Nebraska Nevada New Hampshire New Jersey New Mexico New York North Carolina North Dakota Ohio Oklahoma Oregon Pennsylvania Puerto Rico Rhode Island South Carolina South Dakota Tennessee Texas Utah Vermont Virginia Washington West Virginia Wisconsin Wyoming |
Ohio Polls
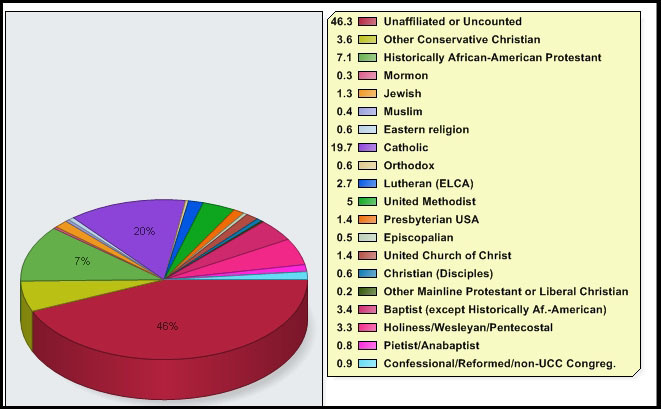
Republican primary exit poll Religious demographics chart
Primary results Republican
Democrat
Commentary Democrat There was no distinctive Catholic problem for Obama in Ohio. In fact, white Catholics were slightly more likely to vote for him than white Protestants. But both preferred Clinton by wide margins—the Protestants by 67-30 and the Catholics by 65-34. White Nones preferred Clinton 53 percent to 42 percent. Basically, it was with white Democrats that Obama had a problem in Ohio. Republican Huckabee got the evangelicals (44 percent of GOP voters) by a narrow margin, 48 percent to 45 percent. He got the more-than-weekly attenders (18 percent of GOP voters) by a larger margin, 54 percent to 46 percent. The core, committed evangelicals were on his side. Otherwise, it was all McCain.
|
||||||||||||||||||||||||||||||||